Date & Time: This webinar is now over, view the recording here.
Choose from over 80 ACD statistics to build out visual business Intelligence for your customers
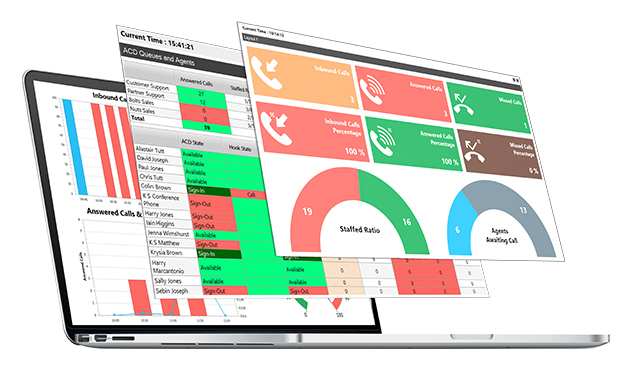
Unity Dashboard is designed as a real-time customer engagement interface that can display summary and drill-down information on current conditions in the call centre. With a range of tiles, gauges and charts Unity displays current metrics, such as Calls In Queue, but can also plot variables over time, such as Abandoned Calls vs Agents Available. All graphical elements can be configured with colour coded threshold alerts, immediately highlighting potential bottlenecks or unusual behaviour.
In this webinar we will be looking at a live demonstration covering:
-Graphical Elements
-Tiles, Badges, Bar Charts, Gauges and Bar & Line Charts
-Configuring scrolling Views
-Graphical vs Tabular layouts
-Non-ACD use for Hosted PBX